library(tidyverse)
library(janitor)
library(readxl)02-analysis
Imported data
study_abroad_combined <- read_rds("data-processed/01-study_abroad_combined.rds")Pivoting the data longer
abroad_long <- study_abroad_combined |> pivot_longer(cols = 3:25, names_to = "AY", values_to = "students")

slice_sample(abroad_long, n = 10)
Creating calendar dates for easier charting
abroad_dates <- abroad_long |> mutate(
  fl_yr = str_c("20", str_sub(AY, -2, -1), "-01-01") |> ymd(),
  yr = year(fl_yr)
)

abroad_dates
Most visited
abroad_dates |>
  group_by(country) |>
  summarize(total_students = sum(students)) |>
  arrange(desc(total_students))
Data Takeaway: The three most visited countries for North American study abroad students are the United Kingdom, Italy and Spain. The Asian country they visit most often is China. The Latin American country visited most often by the same group is Mexico. The African country visited most often by North American study abroad students is South Africa. The Caribbean country visited most often is Cuba.
Least visited
abroad_dates |>
  group_by(country) |>
  summarize(total_students = sum(students)) |>
  arrange(total_students)
Data takeaway: Among some of the countries least visited by North American students for study abroad are Andorra, North Korea, Libya and Turkmenistan.
Countries over time
students_over_time <- abroad_dates |>
  group_by(region, yr) |>
  summarize(total_students = sum(students, na.rm = TRUE))
`summarise()` has grouped output by 'region'. You can override using the
`.groups` argument.students_over_timePlotted study abroad destinations over time
ggplot(students_over_time, aes(x = yr, y = total_students)) +
  geom_line(aes(color = region)) +
  labs(
    title = "Europe outpaces all other world regions as a study abroad destination",
    subtitle = str_wrap("North American students chhose Europe nearly four times as often as the next leading world region"),
    caption = "By Katrina L. Spencer, Source: Institute of International Education",
    x = "Year", y = "Students studying abroad")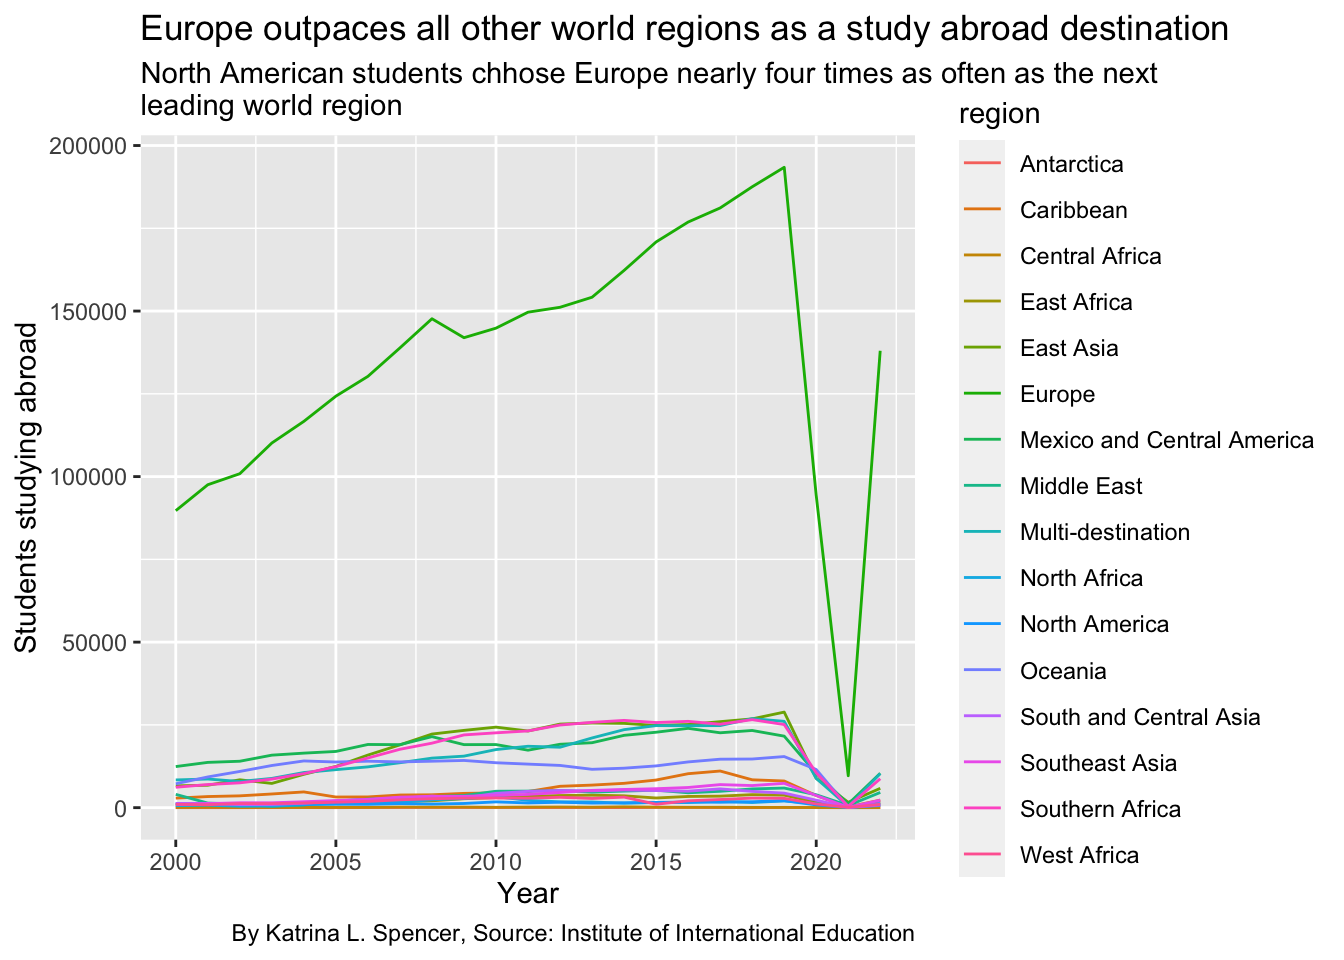
Data takeaway: Europe, by far, is the most visited world region by far by North American students for study abroad.
Study abroad destinations excluding Europe for easier visualization compared to previous chart
students_over_time |> filter(region != "Europe") |>
  ggplot(aes(x = yr, y = total_students)) +
  geom_line(aes(color = region)) +
  labs(title = str_wrap("Study Abroad Destinations, 2000-2022"), caption = "By Katrina L. Spencer")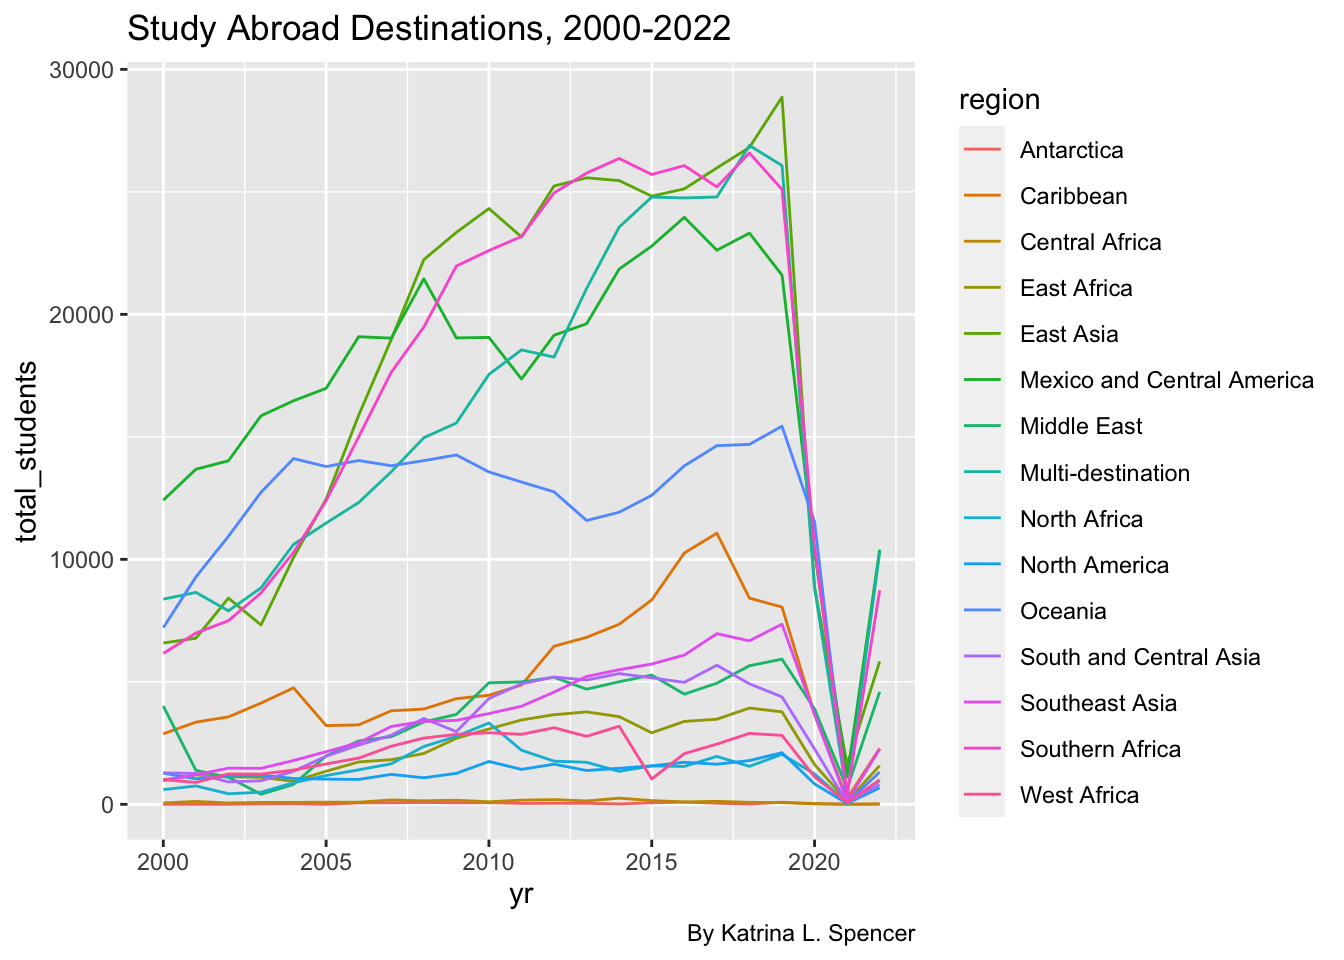
Data takeaway: East Asia is the second most visited world region by North American study abroad students.
Impact of 2001’s 9/11 Terrorist Attack Study Abroad to the Middle East
students_over_time |> filter(region == "Middle East") |>
  ggplot(aes(x = yr, y = total_students)) +
geom_col() 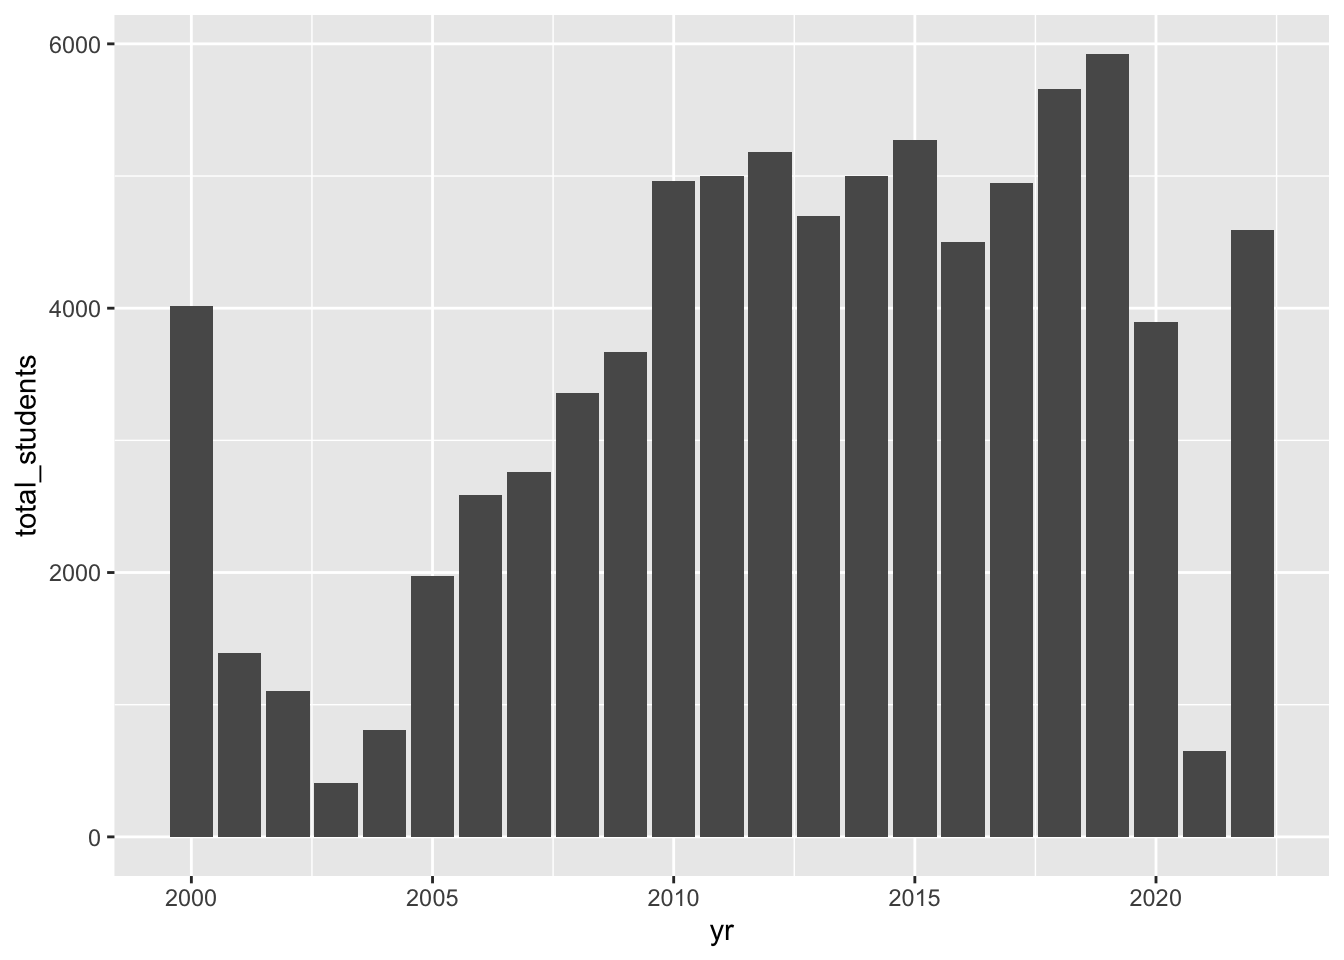
Data Takeaway: About 4,000 North Americans studied abroad in the Middle East in 2000. That number was reduced to a third of that figure in 2001, which coincides with the September 11th attacks. The number of students continued to reduce, meeting its lowest amount for the period of 1999- 2022, in 2003. Even fewer students studied abroad in the Middle East in 2003 than during the 2021 period of the global COVID-19 pandemic in 2021. In 2019, nearly 6,000 North American students studied abroad in the Middle East, the highest number for the 1999- 2022 period.
Countries in the Middle East visited
abroad_dates |> filter(region == "Middle East") |>
  ggplot(aes(x = yr, y = students)) + geom_line(aes(color = country))
Data takeaway: The three countries most often visited by North American study abroad students between 1999 and 2022 were Israel, Jordan and the United Arab Emirates.
Plotting Mexico and Central America as study abroad destinations for North American students
abroad_dates |> filter(region == "Mexico and Central America") |>
  ggplot(aes(x = yr, y = students)) + geom_line(aes(color = country))
Data takeaway: The dramatic decline in students from the United States visiting Mexico for study abroad coincides with the Mexican drug war. Between 2009 and 2014, Mexico lost 70% of its study abroad students. This period also coincided with a dramatic rise in study abroad to Costa Rica. In the same time period, study abroad to Costa Rica reached its highest point, moving from just over 6,000 participants in 2009 to over 8,000 in 2015.
Plotting East Asia as study abroad destinations for North American students
abroad_dates |> filter(region == "East Asia") |>
  ggplot(aes(x = yr, y = students)) + geom_line(aes(color = country)) +
  geom_point(aes(color = country))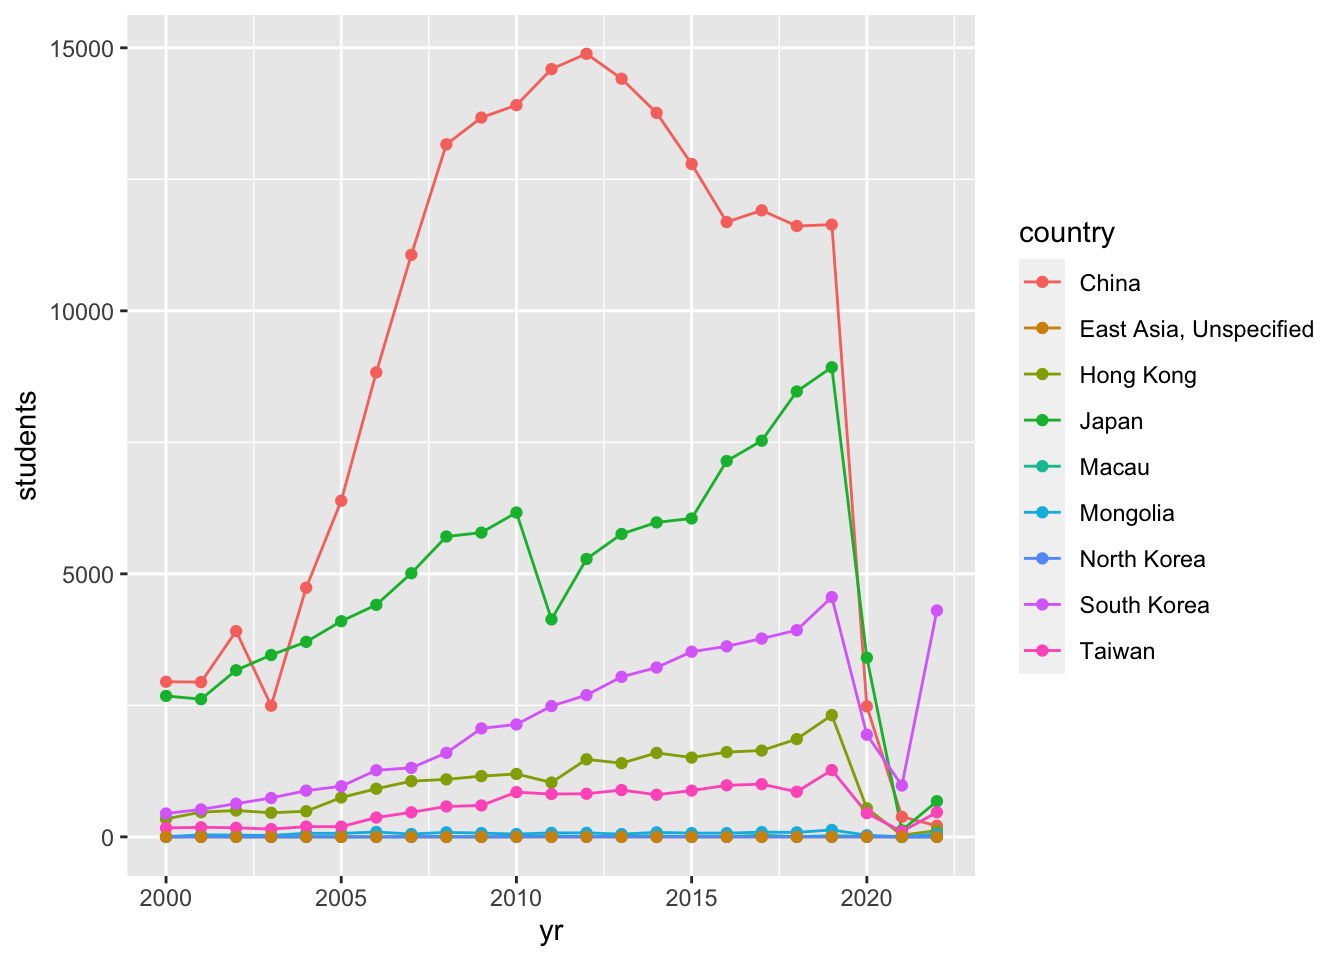
Data takeaway: Of the East Asian countries, North American students visits China, Japan and South Korea most for study abroad.
Studying impact on study abroad to Haiti following its 2010 Earthquake
abroad_dates |> filter(country == "Haiti") |>
  ggplot(aes(x = yr, y = students)) + geom_line(aes(color = country)) +
  geom_point(aes(color = country)) +
  labs(
    title = str_wrap("North American students flock to Haiti following the country's 2010 earthquake"),
    subtitle = str_wrap("The earthquake was followed by a 4-year surge in study abroad participation in the country, multiplying total students by about nine."),
    caption = "By Katrina L. Spencer, Source: Institute of International Education",
    x = "Year", y = "Students studying abroad")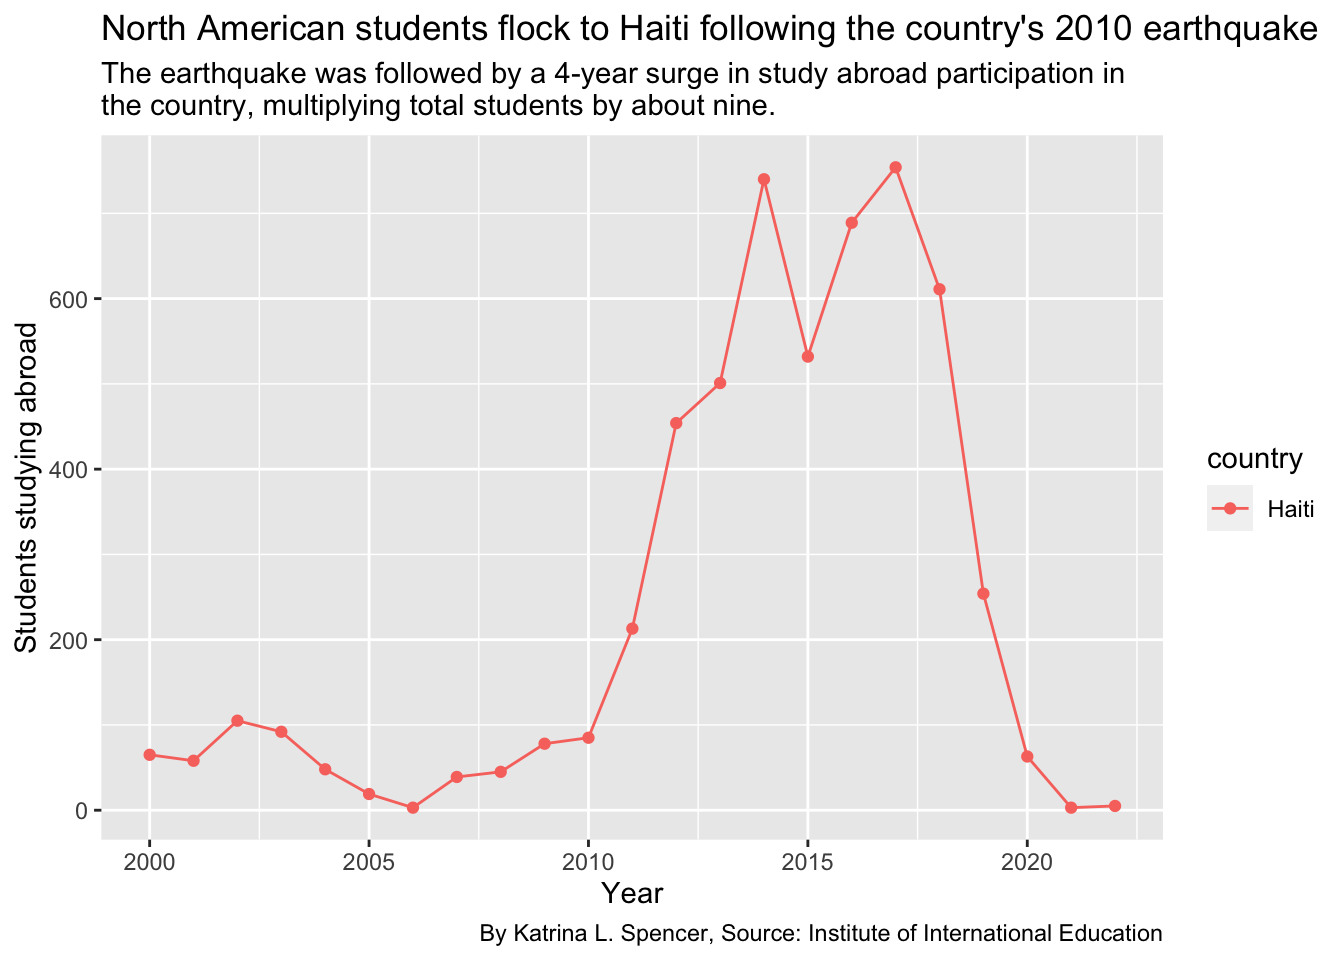
ggsave("figures/haiti-plot.png")Saving 7 x 5 in imageData Takeaway: Haiti saw a dramatic increase of North American students studying abroad there following its 2010 earthquake. By 2014, six times as many students visited Haiti as in 2010.
Studying the impact of the 2014 World Cup, the 2015- 16 Zika virus outbreak and the 2016 Olympics in Brazil
abroad_dates |> filter(country == "Brazil") |>
  ggplot(aes(x = yr, y = students)) + geom_line(aes(color = country)) +
  geom_point(aes(color = country)) +
  labs(
    title = str_wrap("North American students flock to Brazil for study abroad ahead of the 2014 World Cup"),
    subtitle = str_wrap("Study abroad over a 20-year period peaked in Brazil amid the 2014 World Cup, but the surge was abruptly cut when the Zika Virus Outbreak of 2015-16 arrived"),
    caption = "By Katrina L. Spencer, Source: Institute of International Education",
    x = "Year", y = "Students studying abroad")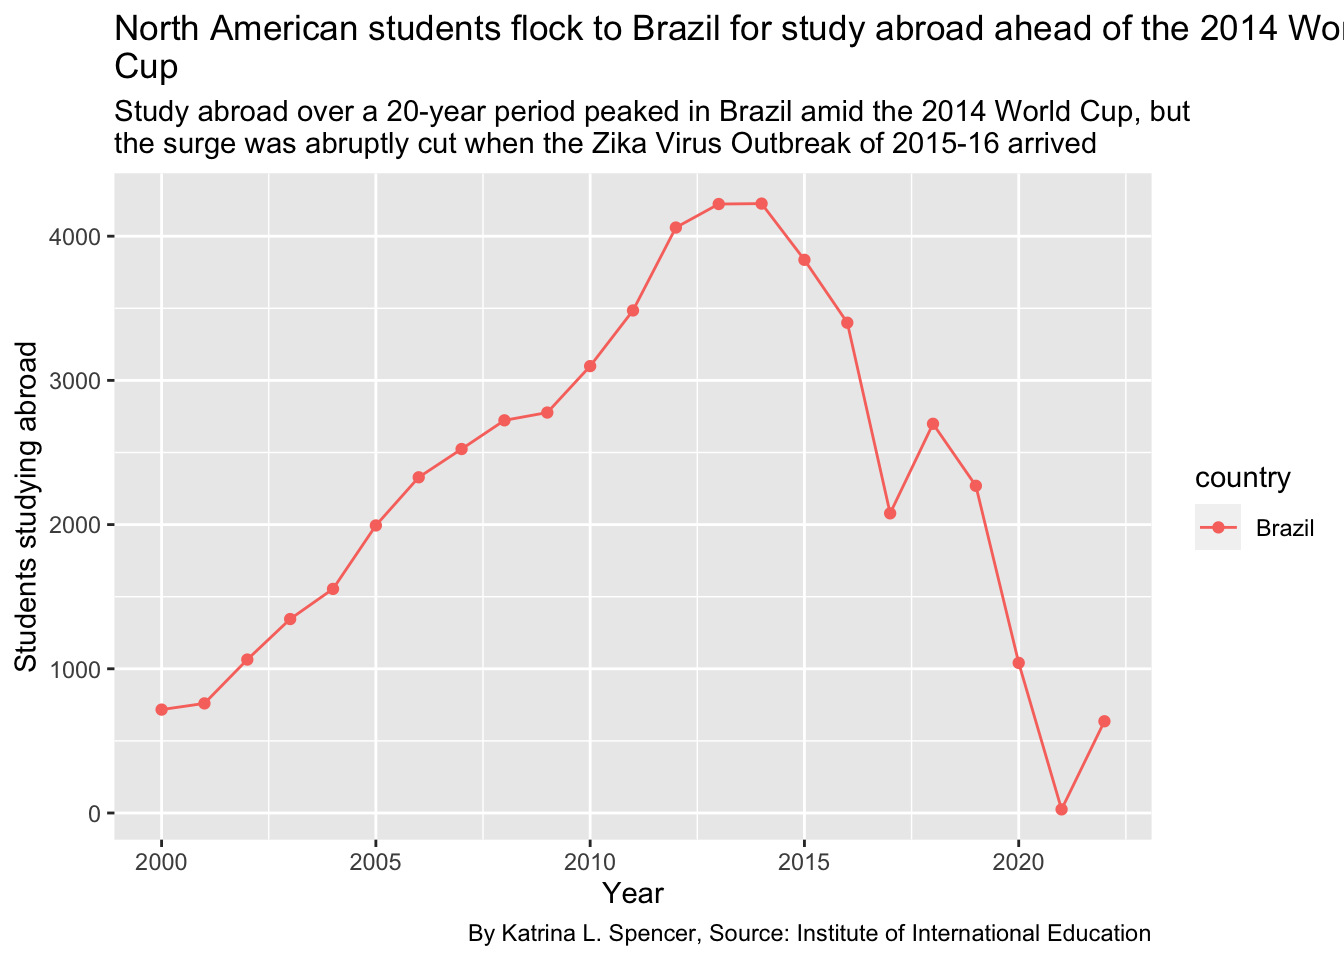
ggsave("figures/brazil-plot.png")Saving 7 x 5 in imageData Takeaway: Study abroad participation for North American students to Brazil peaked in 2013 and 2014 over the 1999-2022 time span. This peak coincides with the World Cup being hosted in Brazil. Shortly thereafter, however, there were sharp declines, which coincided with both the end of the World Cup and the Zika virus outbreak in 2015-2016. While there were just over 4,000 North American students in 2013 and 2014 in Brazil, the number dropped to about half that sum in 2016.
Impact of 2011 Japanese Tsunami on Study Abroad and 2020’s Olympic Games Hosted in Tokyo
abroad_dates |> filter(country == "Japan") |>
  ggplot(aes(x = yr, y = students)) + geom_line(aes(color = country)) +
  geom_point(aes(color = country))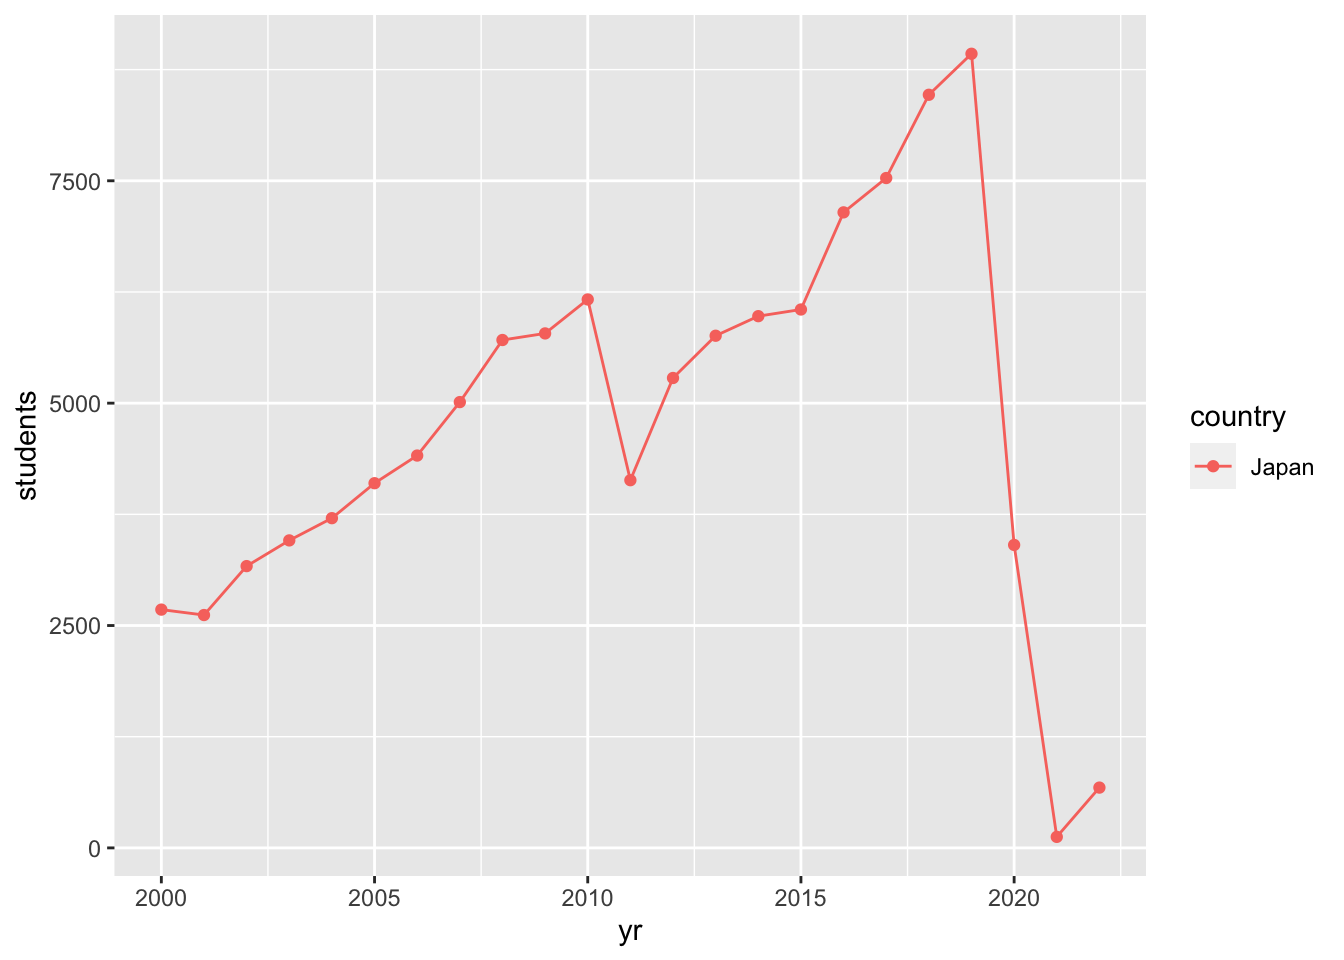
Data Takeaway: There was a sharp and sudden decline in North American students studying abroad in Japan in 2011, which coincided with the country’s tsunami that year. Programs lost more than 1,000 participants, which made up about one-sixth of its total in 2010. In 2019, however, right before Japan hosted the Olympic games, the total number of students present was about three times as high than it was in the year 2000. North American study abroad participants in Japan peaked at over 8,000 in number in 2019, preceding a sharp decline to 0 in 2021, coinciding with the COVID-19 global pandemic.
Study abroad in Canada
abroad_dates |> filter(country == "Canada") |>
  ggplot(aes(x = yr, y = students)) + geom_line(aes(color = country)) +
  geom_point(aes(color = country))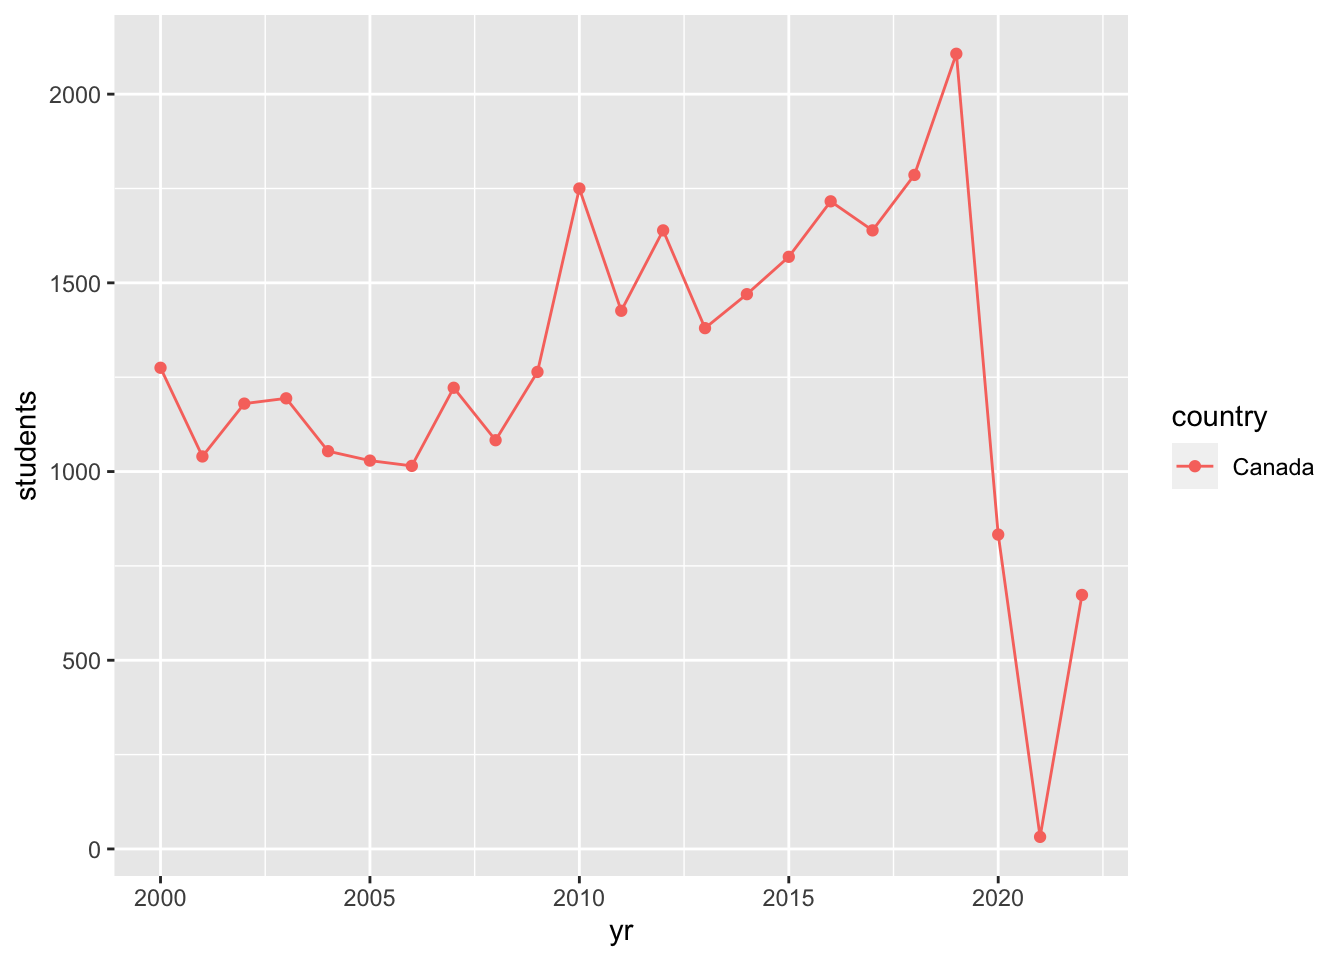
Study abroad in Australia and New Zealand
abroad_dates |> filter(country == "Australia" | country == "New Zealand") |>
  ggplot(aes(x = yr, y = students)) + geom_line(aes(color = country)) +
  geom_point(aes(color = country))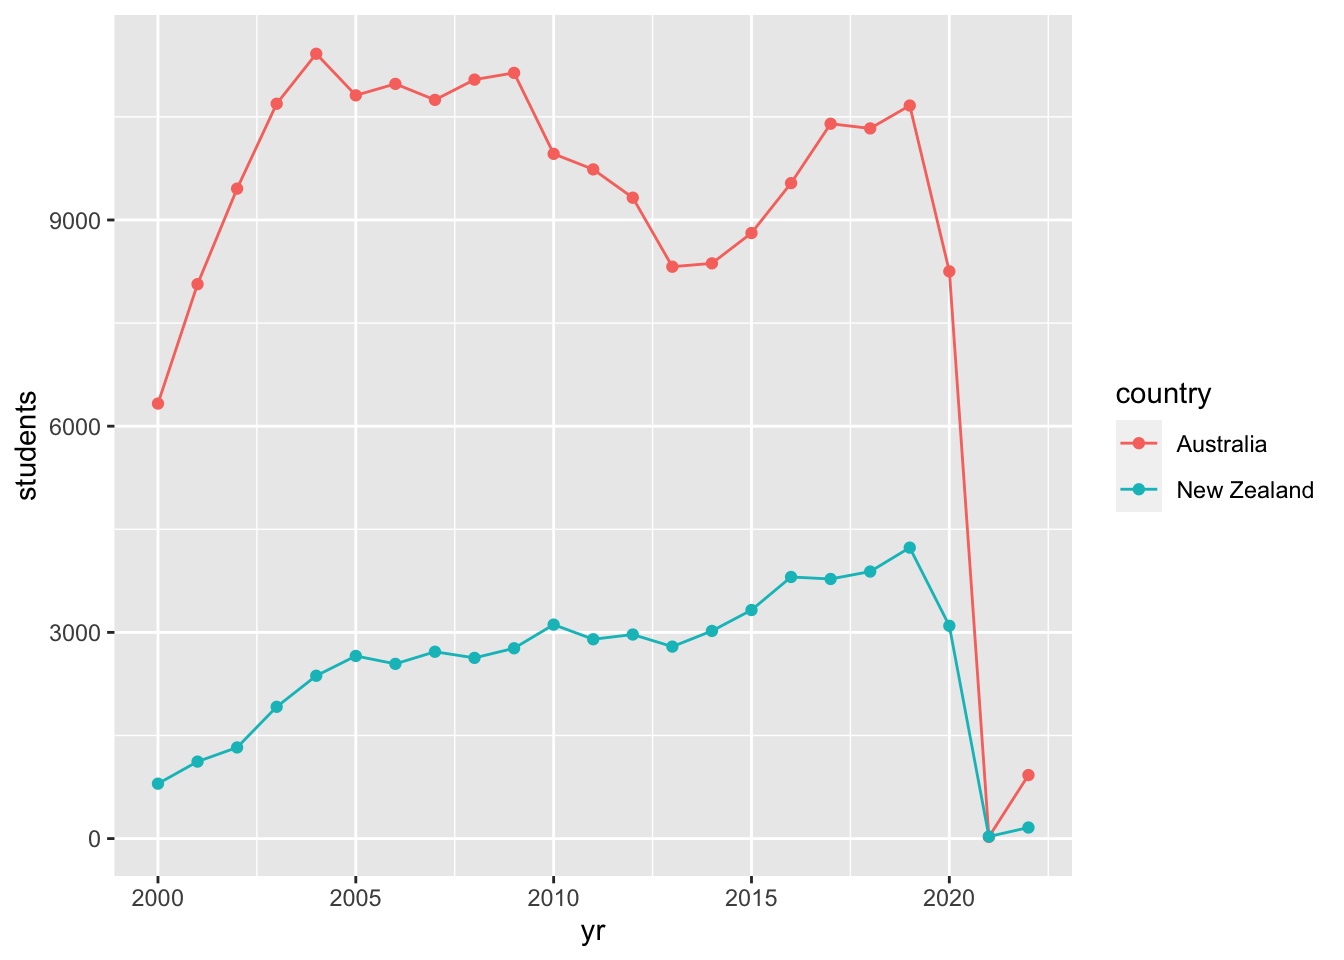
Study abroad in Costa Rica
abroad_dates |> filter(country == "Costa Rica") |>
  ggplot(aes(x = yr, y = students)) + geom_line(aes(color = country)) +
  geom_point(aes(color = country))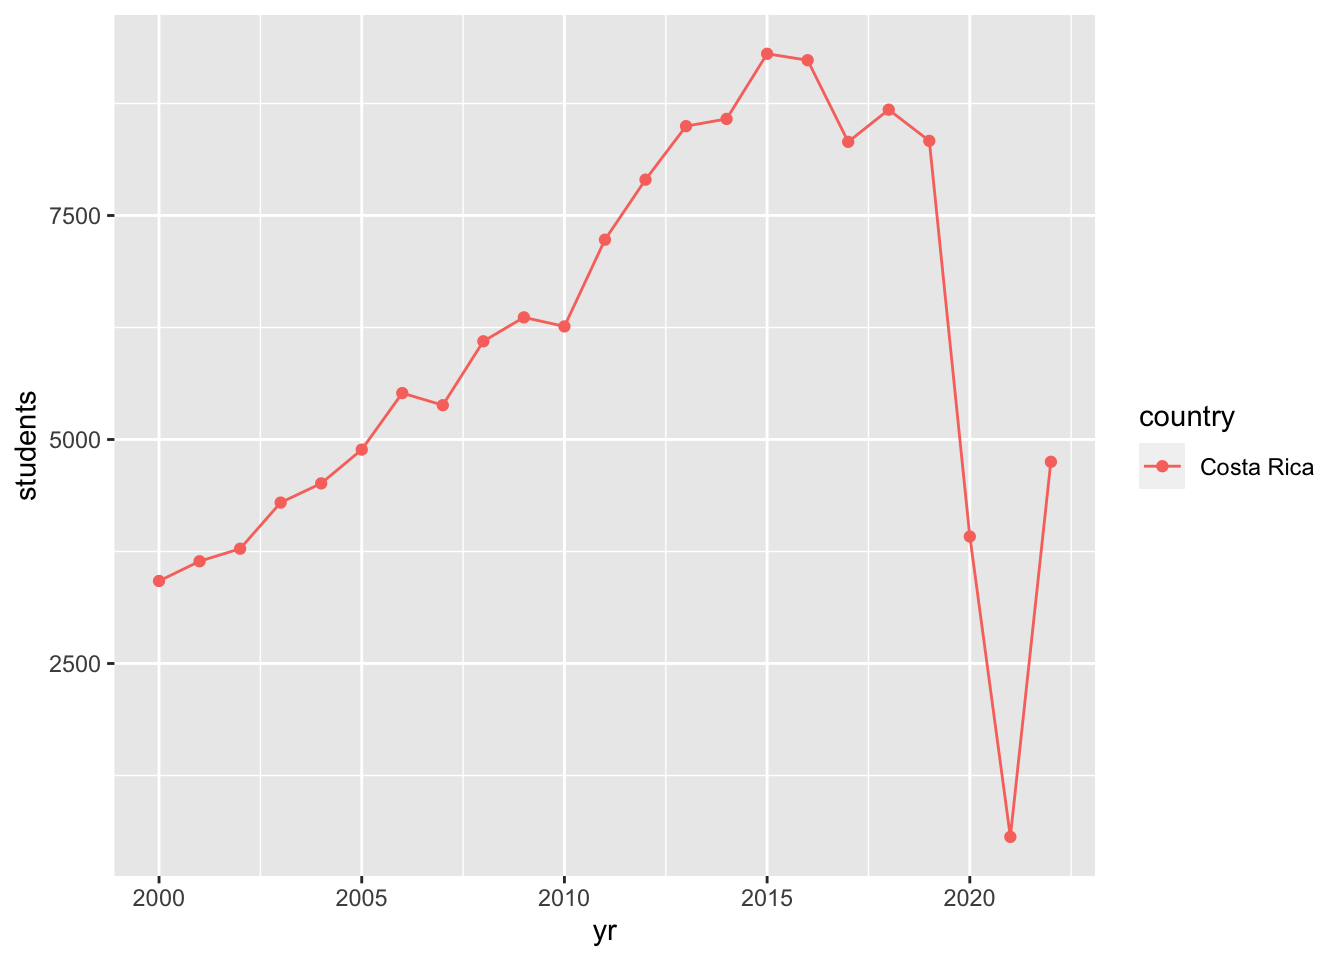
Study abroad in Cuba
abroad_dates |> filter(country == "Cuba") |>
  ggplot(aes(x = yr, y = students)) + geom_line(aes(color = country)) +
  geom_point(aes(color = country))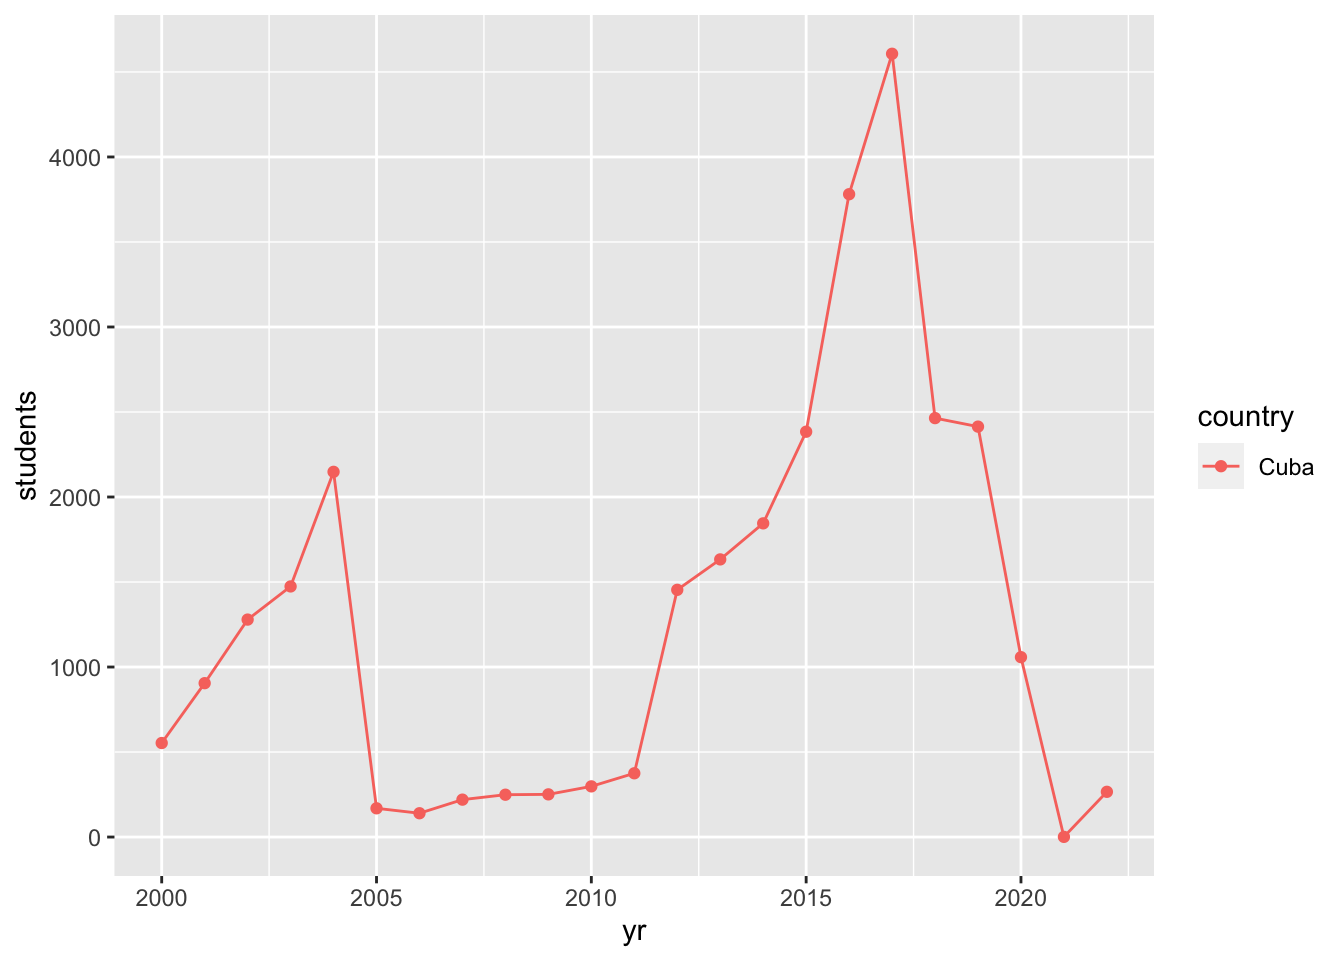
Data takeaway: Following Cuban president Fidel Castro’s death in 2016, study abroad for North American students to the island country jumped from about 2,500 in 2015 to over 4,000 in 2017.
Study abroad in North Korea
abroad_dates |> filter(country == "North Korea") |>
  ggplot(aes(x = yr, y = students)) + geom_line(aes(color = country)) +
  geom_point(aes(color = country))
Study abroad in Russia
abroad_dates |> filter(country == "Russia") |>
  ggplot(aes(x = yr, y = students)) + geom_line(aes(color = country)) +
  geom_point(aes(color = country))
Study abroad in the Philippines
abroad_dates |> filter(country == "Philippines") |>
  ggplot(aes(x = yr, y = students)) + geom_line(aes(color = country)) +
  geom_point(aes(color = country))
Data takeaway: The Philippines’ Department of Tourism designated 2015 as the “Visit the Philippines Year.” Based on two years preceding this declaration and two years following, the campaign appeared to be successful. About 275 North American students studied abroad in the Philippines in 2013. More than 500 studied there in 2017.
Study abroad in five English-speaking African nations: Ghana, Kenya, Liberia, Nigeria and South Africa
abroad_dates |> filter(country == "Ghana" | country == "Nigeria" | country == "South Africa" | country == "Liberia" | country == "Kenya")|>
  ggplot(aes(x = yr, y = students)) + geom_line(aes(color = country)) +
  geom_point(aes(color = country))
Data takeaway: While Nigeria is the most populous country on the African continent, it receives the least amount of North American study abroad students between several English-speaking countries including Ghana, Kenya, Liberia and South Africa. South Africa, on the other hand, has seen a rather steady increase in interest from the same group over a 17-year period. Participants have grown six times in number from around 1,000 in the year 2000 and to 6,000 in 2017.
Study abroad in three French-speaking African nations
abroad_dates |> filter(country == "Cameroon" | country == "Senegal" | country == "Togo" ) |>
  ggplot(aes(x = yr, y = students)) + geom_line(aes(color = country)) +
  geom_point(aes(color = country))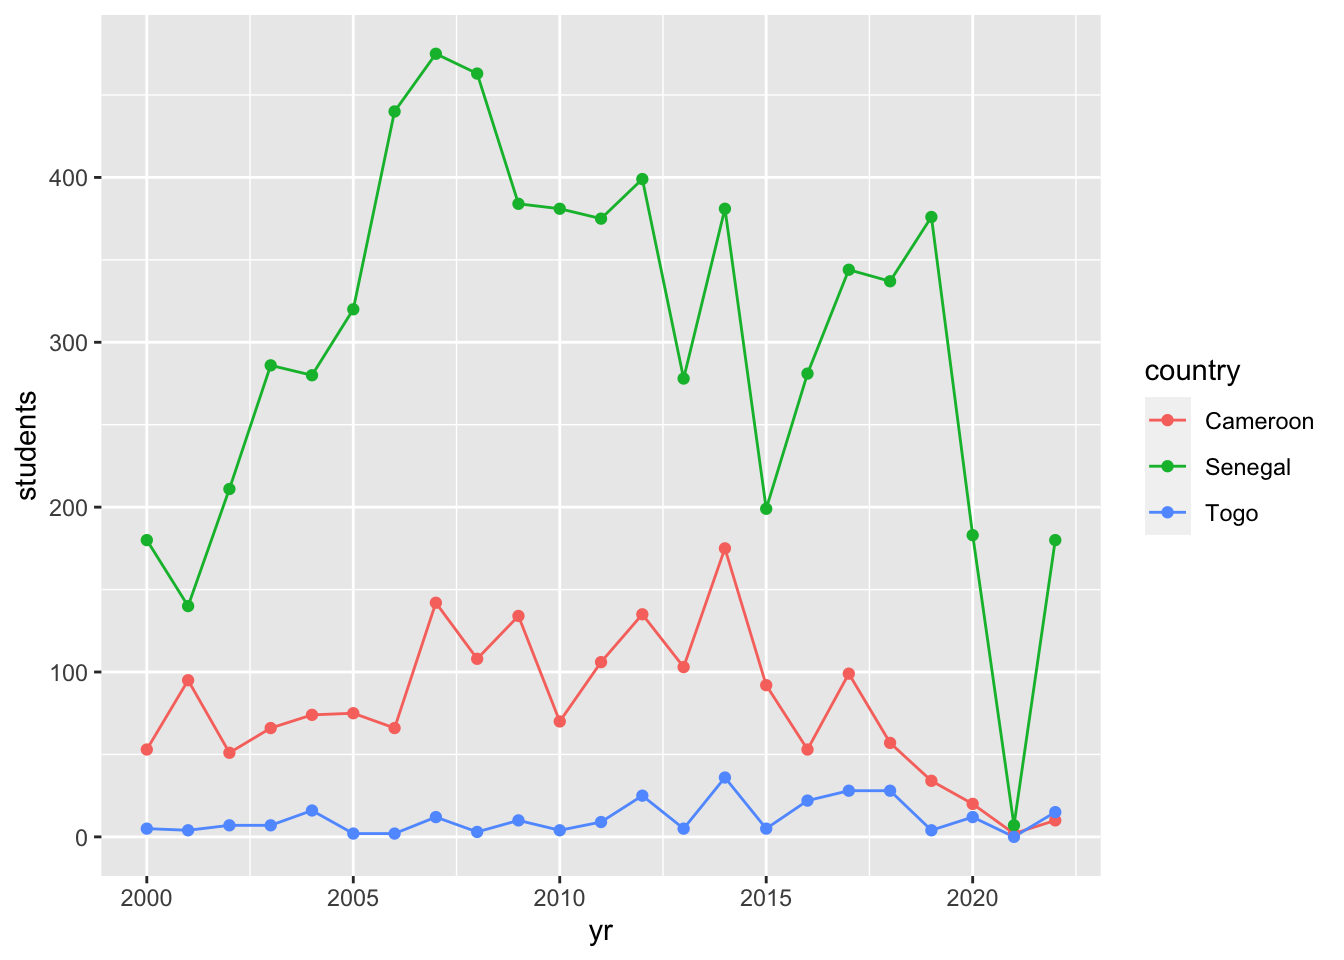
Study abroad in two Portuguese-speaking African nations
abroad_dates |> filter(country == "Mozambique" | country == "Angola") |>
  ggplot(aes(x = yr, y = students)) + geom_line(aes(color = country)) +
  geom_point(aes(color = country))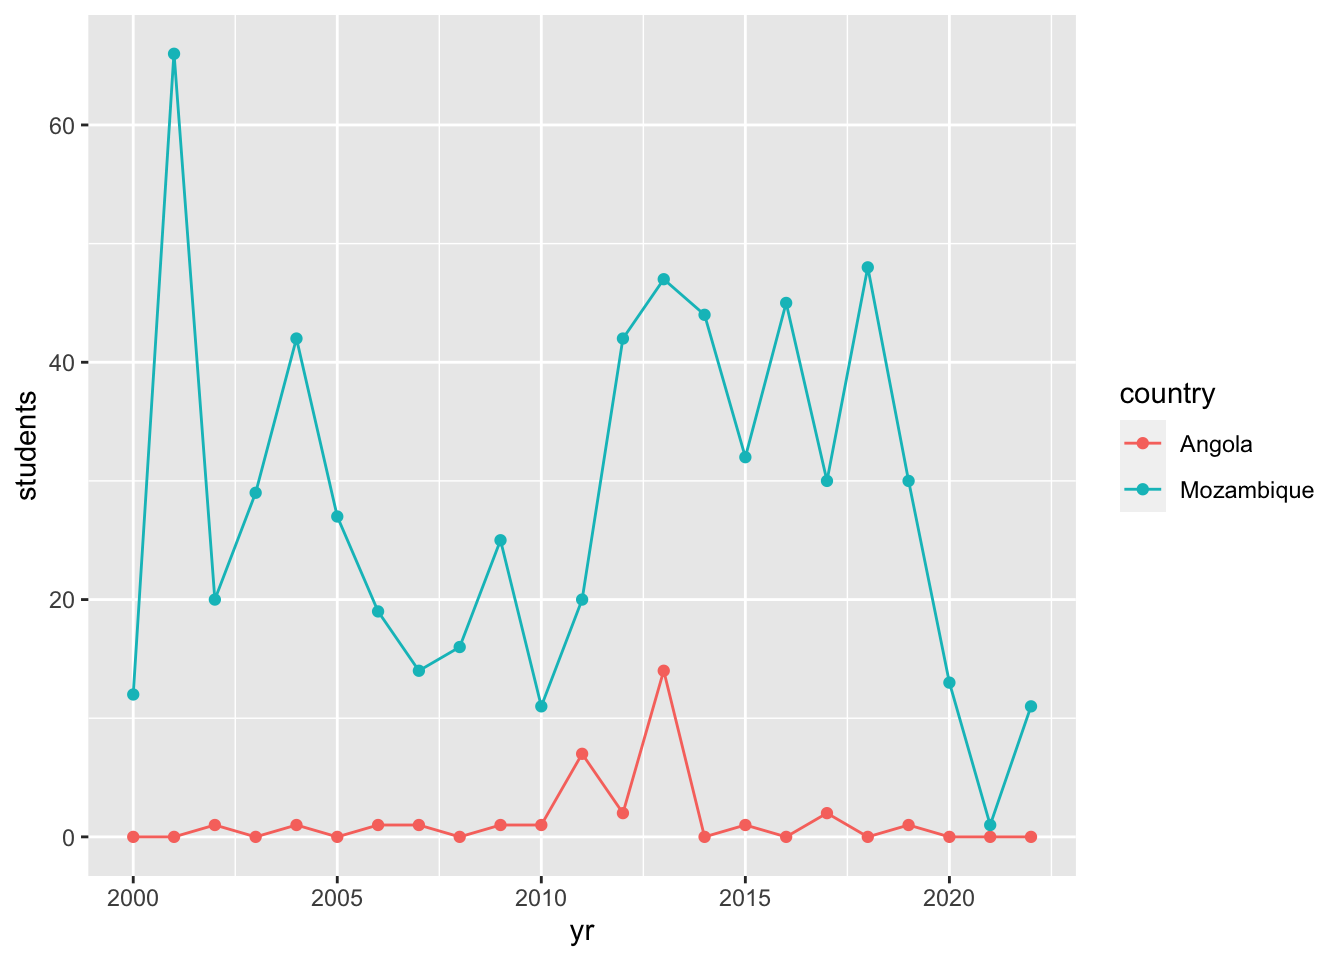
Study abroad to countries ending in -stan
abroad_dates |> filter(country == "Afghanistan" | country == "Turkmenistan" | country == "Tajikistan" | country == "Pakistan" | country == "Uzbekistan" | country == "Kyrgyzstan" | country == "Kazakhstan") |>
  ggplot(aes(x = yr, y = students)) + geom_line(aes(color = country)) +
  geom_point(aes(color = country))